One of the strategies investors and analysts use to determine where to invest in the stock market is to study trends and patterns for an apparent price shift. Being able to spot patterns and identify what they mean may improve opportunities for success.
One of the more well-known patterns is called the head and shoulders pattern, which is a price reversal pattern. It’s a technical analysis that, when appropriately identified, may be used to predict a trend reversal. Let’s break down what this pattern is, how it works, and how you can use it to improve your trading strategy.
The head and shoulders pattern is a technical analysis chart pattern that signals a potential reversal in a stock’s price movement.
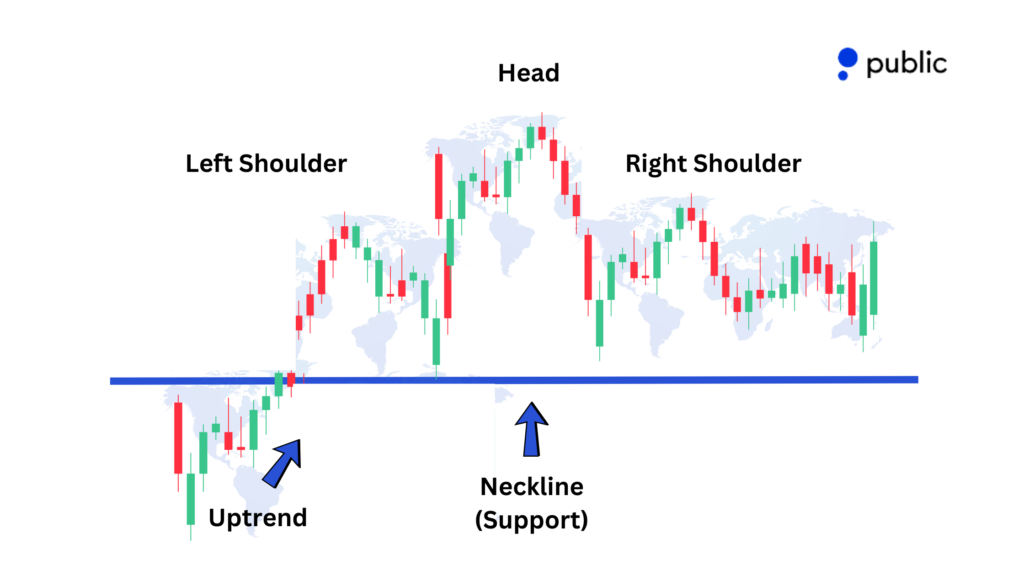
This pattern consists of three peaks:
The left shoulder: This is the first peak, which is followed by a minor decline.
The head: The highest peak in the pattern, indicating a stronger upward move, followed by another decline.
The right shoulder: A smaller peak that is usually similar in height to the left shoulder, indicating a weakening upward trend.
Beneath these peaks is the neckline, a support line connecting the lows of the left and right shoulders. The neckline is a critical indicator because its breakout may confirm the pattern and signal a potential price reversal.
Inverted head and shoulders pattern
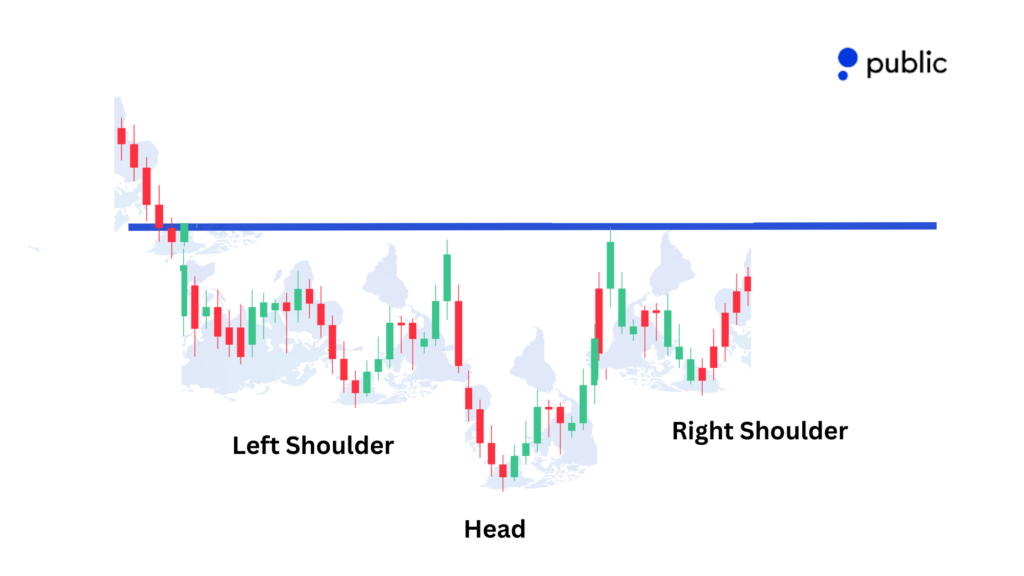
The inverted head and shoulders pattern, also called a reverse head and shoulders pattern, is essentially the opposite of the standard (head and shoulders) pattern. It may signal a reversal from a bearish trend to a bullish one.
This pattern forms when:
The left shoulder forms as the price dips to a low and then rises slightly.
The head appears as the price falls further, reaching a lower low before recovering.
The right shoulder develops, dipping to a higher low than the head.
Finally, the price may break above the neckline, which may confirm a bullish trend reversal.
This pattern can indicate that selling pressure is fading, and buyers may be gaining control, offering potential opportunities for long positions.
How does the head and shoulders pattern work?
To fully understand how this pattern works, it’s crucial to focus on two variations:
Head and shoulders(standard): This forms after an uptrend and indicates a bearish reversal. Traders may interpret it as a sign that a stock’s upward momentum is fading, and a downward trend may follow.
Inverse head and shoulders: This is the opposite pattern, forming after a downtrend and signaling a bullish reversal. It may indicate that a stock’s downward momentum is losing strength, and an upward trend could be on the horizon.
These patterns can often be used to spot entry and exit points for trades, as well as to set stop-loss levels and profit targets.
Real-world example: Applying head and shoulders patterns
Let’s walk through a hypothetical example to illustrate how you might use a head and shoulders pattern in your trading:
Imagine a XYZ company stock is in an uptrend, and you notice the following:
The stock price rises to $120, forming the left shoulder, and then dips to $115.
It then climbs to $130, forming the head, before dipping back to $115.
Finally, the price rises to $125, forming the right shoulder, and dips back to $115.
You draw a neckline at $115, connecting the two lows.
The price breaks below $115 on high volume, confirming the bearish head and shoulders pattern.
In this scenario:
You may short the stock at $115.
You may place a stop-loss at $125 (just above the right shoulder).
Estimate the price target by subtracting the height of the head ($130 – $115 = $15) from the neckline ($115 – $15 = $100).
Potential advantages of head and shoulders pattern
The head and shoulders pattern, while popular among traders, has its own set of advantages..
1. Reliability
The head and shoulders pattern is widely regarded as one of the most reliable chart patterns in technical analysis. It may provide a clear signal for potential reversals, that can help you avoid emotional trading decisions.
2. Versatility
You can apply this pattern to any timeframe, making it suitable for day trading, swing trading, or long-term investing. Also this pattern can be applied to any market, including stocks, commodities, and forex.
3. Risk management
Traders can establish clear entry and exit points based on the neckline and shoulder peaks, which may allow for effective risk management.
4. Easier to identify
For experienced traders, this pattern is often easier to recognize.
Limitations of the head and shoulders pattern
While this pattern is popular, it may not be foolproof.
Here are some limitations to keep in mind:
False breakouts: The price may temporarily break the neckline but fail to sustain the trend, leading to losses if you enter a trade prematurely.
Subjectivity: Identifying the pattern accurately can sometimes be subjective, especially for new traders.
Dependence on volume: Volume confirmation is crucial, but it’s not always reliable. Low-volume breakouts can lead to false signals.
Risk vs. Reward: Stop-loss distances may be wide, which can impact risk management.
Strategies for trading with the head and shoulders pattern
1. Wait for the pattern to complete
One of the most important aspects of using the head and shoulders pattern is patience. Not all patterns fully form, and some may never lead to a breakout. Wait for a clear breakout before entering a trade to avoid false signals.
2. Identifying entry points
Breakout entry: Enter when the price breaks the neckline.
Pullback entry: Wait for a pullback to the neckline after the breakout. However, this may carry the risk of missing an opportunity if the pullback doesn’t occur.
3. Placing stops
In a standard pattern, stops are often placed above the right shoulder.
In an inverted pattern, stops may be placed below the head, though this is a riskier option.
4. Setting profit targets
The profit target may be calculated as the difference between the head’s peak and the neckline. This difference is then subtracted (for a standard pattern) or added (for an inverted pattern) to the neckline breakout point.
5. Combine with other indicators:
Use the head and shoulders pattern alongside other technical indicators, like moving averages or the Relative Strength Index (RSI), to confirm trends.
7. Stay updated:
Market conditions and stock performance can change rapidly. You can sign up on Public to get real-time data that may help you stay informed.
The bottom line
The head and shoulders chart pattern can be a powerful tool for predicting potential market reversals. By understanding its components recognizing them in real-time, you can make more informed decisions in your investment journey.
As you explore chart patterns and expand your technical analysis skills, remember to leverage Public.com. Public is an all-in-one brokerage where you can build a multi-asset portfolio that includes everything from stocks and options to bonds, crypto, and a High-Yield Cash Account. As a member, you’ll gain access to a powerful suite of tools and data, including our Income Hub, which lets you track monthly earnings from all your interest and dividend-paying assets and forecast your income for the year ahead.
We designed Public for investors who take their financial futures seriously and seek a transparent platform focused on long-term growth. Join Public today and start building your multi-asset portfolio with the tools, data, and insights you need to make informed investment decisions.
We use cookies and similar technologies as described in our
privacy policy.
You can manage your cookie settings at any time.