When you’re diving into technical analysis as an investor, one of the most popular and powerful patterns to recognize is the bull flag. If you’ve ever wondered how seasoned traders pinpoint potential breakouts in stock charts, the bull flag is likely one of their go-to tools.
Let’s break it down so you can understand how this pattern works, why it matters, and how you might use it in your trading strategy.
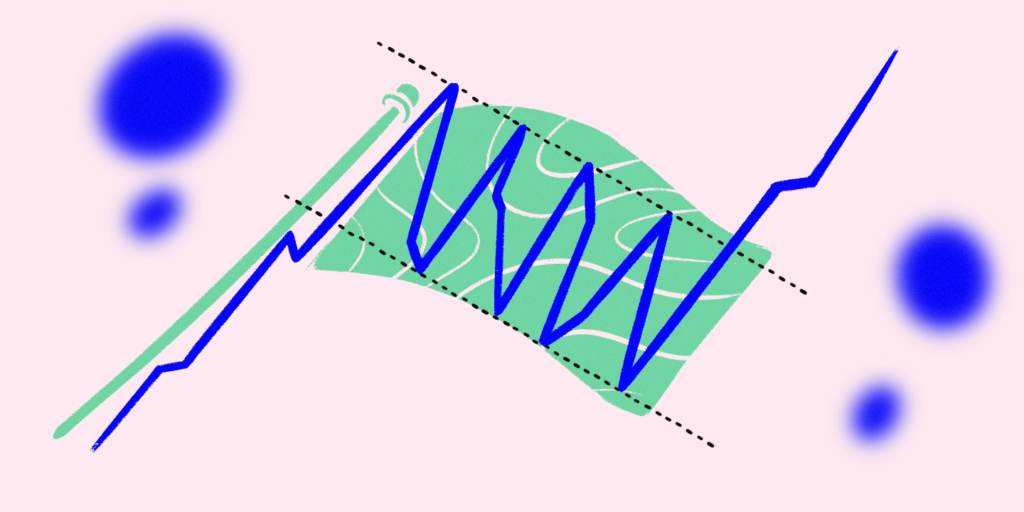
A bull flag is a chart pattern in technical analysis that signals the continuation of an existing upward trend after a brief period of consolidation. This pattern gets its name from its visual similarity to a flag on a flagpole, where a sharp upward movement (the flagpole) is followed by a pause or consolidation phase (the flag). The bull flag often indicates that the stock price is “taking a breather” before resuming its upward trajectory.
The bull flag is categorized as a continuation pattern, suggesting that the price will likely continue moving in the same direction as the trend preceding the pattern. You can often look for a breakout above the upper boundary of the flag to confirm the pattern and signal a buying opportunity.
Key takeaways
The flag pattern consists of a flagpole with a rectangular pattern that resembles a flag on a pole. The flag must not be any more than half the size of the pole.
The flag develops off the flag pole as parallel lines form the flag. The more condensed those lines are, the stronger the signal.
A flag pattern takes time to develop. They are not useful until their upper and lower trendlines are clear. Even then, as with any investment, there could always be a negative outcome.
4 Characteristics of a bull flag pattern
Spotting a bull flag pattern may be tricky, especially for beginners. Here are four key characteristics to look for:
1. Sharp initial rally (Flagpole)
The flagpole is marked by a strong, nearly vertical upward price movement. It shows robust buying interest.
2. Consolidation phase (Flag)
During this phase, the price moves sideways or slightly downward. Volume usually decreases as traders take a breather.
3. Breakout
The breakout happens when the price moves above the resistance level formed during the consolidation phase. Ideally, this is accompanied by a surge in volume.
4. Volume pattern
The rally (flagpole) is usually accompanied by high volume, while the consolidation phase occurs on lower volume. A spike in volume during the breakout confirms the pattern.
Why is the bullish flag pattern important for investors?
Markets continue to experience volatility driven by economic factors such as inflation, interest rates, and global events. Recognizing a bull flag pattern may give you a clearer picture of when to enter or add to a position in a rising stock. Here’s why it’s relevant:
High success rate: When correctly identified, the bull flag pattern can have a strong probability of leading to continued upward momentum.
Short-term trading advantage: It can be particularly useful for swing traders or those looking to capitalize on short- to medium-term price movements.
Fits various markets: Whether you’re trading stocks, ETFs, or crypto, the bull flag pattern might work across asset classes.
How to identify a bull flag pattern?
Recognizing a bull flag requires a trained eye, but with practice, it becomes easier. Here’s what to look for:
Start by identifying a sharp upward price movement (the flagpole).
Look for a rectangular or downward-sloping consolidation phase (the flag).
Wait for the breakout, where the price pushes above the consolidation range.
Example of a bull flag pattern in action
Imagine you’re analyzing an XYZ company stock that’s been performing well amid strong sector growth. Here’s how you might identify a bull flag pattern:
Flagpole formation: The stock’s price jumps from $50 to $70 in just a few trading sessions on high volume, creating the flagpole.
Flag consolidation: Over the next week, the price consolidates between $68 and $72, forming a downward-sloping channel on low volume.
Breakout: The stock breaks above $72 on higher volume, signaling the continuation of the upward trend.
In this scenario, entering the trade after the breakout might position you to benefit from the stock’s continued rally.
Potential advantages and disadvantages of a bullish flag
Like any trading pattern, the bull flag has its pros and cons.
Advantages:
Clear entry and exit points: The pattern can provide specific levels for entering trades and setting stop-losses.
High reward-to-risk ratio: With a defined profit target and tight stop-loss, traders can manage risk effectively.
Trend confirmation: The bull flag often aligns with strong upward trends, increasing its reliability.
Disadvantages:
False breakouts: Not every breakout leads to a continuation of the uptrend.
Time-consuming: The pattern may take weeks to develop fully.
Market dependence: External factors, such as news or market volatility, can invalidate the pattern.
4 Key strategies for trading the bull flag pattern
To establish a trading strategy, identifying below 3 key points can help.
1. Entry point:
You can enter the trade only after the price breaks above the flag’s resistance. Waiting for the breakout might help avoid false signals.
2. Stop-loss:
Place a stop-loss just below the flag’s support level. For example, if the flag ranges between $50 and $55, your stop-loss could be set below $50.
3. Profit target:
You can set your profit target by adding the flagpole length to the breakout price. If the flagpole is $10 long and the breakout occurs at $55, your target would be $65.
4. Consider the market context:
Always analyze the broader market trend to confirm the validity of the pattern. A bullish pattern in a bearish market might not yield the expected results.
The bottom line
The bullish flag formation is a pattern that may signal a stock’s potential to move higher. By understanding its components, waiting for confirmation, and implementing sound risk management, you can use this pattern to enhance your trading strategy. Learning patterns such as the cup and handle pattern, the head and shoulders pattern, golden cross pattern, and the bull flag pattern can help investors identify stock market trends and make better decisions about when to make trades.
Want to learn more and take your first steps to start investing, download the Public app today! At Public, we’re serious about support and security. Our US-based, FINRA-licensed team is here when you need them, and your investments are protected with SIPC and FDIC coverage so you can confidently work toward your financial goals.
We use cookies and similar technologies as described in our
privacy policy.
You can manage your cookie settings at any time.