When investing in stocks, it’s not only important to understand your investment goals and risk tolerance, but it’s also important to do research on the companies you’re investing in. A common method used by investors to assess a company’s profitability is known as EPS.
So, what does EPS stand for, and how can it support your investment goals? Let’s explore how to calculate EPS and everything you need to know about this essential financial metric.
What is earnings per share (EPS)?
Earnings per share (EPS) is a dollar value that represents a public company’s profit in a given period.
In simple terms, it shows how much money a company makes for each share you own. When you’re analyzing a stock, EPS may give you a quick snapshot of the company’s financial health and profitability on a per-share basis.
As part of a quarterly or annual earnings report, a company calculates its profit (aka earnings) per share. EPS results can contribute to an investors decision to buy, sell, or hold.
Key Takeaways
EPS meaning Earnings per share (EPS) measures how much money a company earns from each of its shares of stock and is used by investors to assess the company’s profitability.
EPS is calculated by dividing the net profit by the number of outstanding shares.
Diluted EPS accounts for a company’s convertible securities, which could potentially dilute the number of shares.
Why EPS matters to investors?
EPS is a key metric that may help you determine a company’s profitability. A high EPS generally signals a profitable company, while a lower EPS might indicate financial struggles. Here’s why EPS should matter to you:
Evaluate profitability: EPS provides a quick snapshot of a company’s profitability, making it easier to compare with others in the same industry.
Compare investment options: EPS can be used alongside other metrics to compare companies in the same sector.
Estimate potential returns: High EPS could mean better potential returns if the company continues to grow and distribute profits.
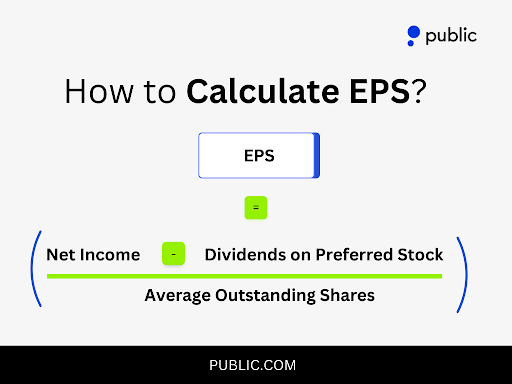
EPS is calculated by dividing a company’s net income (after taxes) by its total outstanding shares. Here’s the formula:
EPS: Net income – Dividends on preferred stock / Average outstanding shares
The number of shares outstanding can be a “simple average” or a “weighted average,” depending on the accounting methods used.
Net income: This is the total profit of a company after all expenses, taxes, and interest are subtracted.
Dividends on preferred stock: These dividends are excluded in EPS calculations because they’re paid to preferred shareholders, not common stockholders.
Outstanding shares: These are the shares currently held by all shareholders, including restricted shares owned by insiders.
For example, if a company has a net income of $10 million and 5 million shares outstanding, its EPS would be $2.00.
Earnings per share in practice
Because the number of outstanding shares can vary during the year, you can get a more accurate calculation by using the weighted average number of shares. These steps can be used to calculate the weighted shares.
Step 1: Determine the number of outstanding shares after each change in common shares. This can include issuing new shares, which increases the shares, or repurchasing shares, which decreases the number of outstanding shares.
Step 2: Weigh the outstanding shares by the block of time between the changes.
Step 3: Total the weighted average number of shares outstanding.
For example, let’s say Company X had a net income of $1,000,000 this year with no outstanding preferred stock shares. They had 50,000 shares outstanding during the year. The calculation would read: (1,000,000 – 0) / 500,000 = $2.0, meaning the company’s EPS equals $2.
Types of EPS
There are various types of EPS that investors and analysts may focus on. Each offers a different perspective on a company’s profitability:
1. Basic EPS:
Basic EPS simply divides net income by the total outstanding shares. However, it doesn’t account for potentially dilutive securities, like stock options or convertible debt, which may increase the number of shares.
2. Diluted EPS:
Diluted EPS includes the impact of potential share dilution from securities such as stock options or convertible bonds. If a company has dilutive securities, this measure shows you a more conservative EPS.
Diluted EPS = Net Income − Preferred Dividends / Weighted Average Shares Outstanding + Dilutive Securities
3. Trailing EPS:
Trailing EPS refers to the EPS calculated using data from the previous 12 months. This figure may provide you with a historical view of the company’s earnings.
4. Forward EPS:
Forward EPS uses analyst predictions or company guidance to estimate future profitability. This may give you an idea of expected performance, although it’s not as reliable as actual earnings.
How EPS impacts stock price?
EPS may play a significant role in influencing stock prices, especially around earnings season when companies report their financial results. If a company’s reported EPS is higher than expected, you’ll may see its stock price rise due to positive investor sentiment. Conversely, a lower-than-expected EPS may lead to a drop in stock price.
EPS is also essential when calculating the P/E ratio. Dividing the stock price by EPS gives you this popular metric, which shows whether a stock might be overvalued or undervalued:
High P/E may mean investors expect growth and are willing to pay more per dollar of earnings.
Low P/E might indicate undervaluation or that investors have lower expectations for growth.
What‘s a good EPS ratio?
You might be wondering if a high earnings per share ratio is good. What’s an ideal EPS ratio?
Several factors need to be taken into account to define a good EPS in stocks. Those include the company’s recent performance, the competitor’s performance, and analysts’ expectations of the stock. As a rule of thumb, the higher a company’s EPS, the more likely it is to be profitable. Still, as we well know, there’s no guarantee of performance in the future when it comes to investing.
It’s important to note that how a company reports expenses and earnings can manipulate the reliability of the EPS, so identifying accounting changes can help determine EPS accuracy.
Comparing earnings per share ratios
Comparing EPS ratios can be a helpful indicator when investing in stocks. When a company’s EPS shows continued growth over time, it can be a good sign that it’s able to maintain profitability. On the other hand, when you see dropping EPS numbers, it can be a sign the company’s losing money.
In addition to EPS, another factor to consider when looking at a company’s financial health is the price-to-earnings ratio (P/E ratio). A higher P/E ratio may indicate expected higher earnings or possibly suggest the company is overvalued. The more research is done and the metrics used in gathering data, the clearer picture you will get of a company and its financial health.
Basic vs. Diluted EPS
When reviewing a company’s income statement, knowing the difference between EPS and diluted EPS can help determine the calculation you’ll want to use to get the most accurate information. Basic EPS doesn’t account for additional stock options or warrants, which, if exercised, may increase the stock shares that are outstanding in the market. This means that you’ll want to evaluate the business as a whole, how profitable it is, and the profits per share, since each share of stock represents ownership in that company.
To review, the basic formula for EPS is:
Earnings per share = Net income – Preferred dividends / End-of-period common shares
For comparison, the diluted EPS formula is:
Diluted earnings per share = Net income – Preferred dividends / Total weighted average # Shares + Other dilutive securities
Investors interested in dividends will likely want to use the diluted EPS calculation. However, the reality is that despite a companys profits, shareholders may not receive much per share, which isnt great for investors who want to invest to receive dividends, so using the correct formula gives them a better idea of what to expect.
There are a few reasons shareholders may not see profits (diluted). For example, a merger with new shares being issued or vesting periods coming to an end can dilute a stock.
Factors that influence EPS
EPS can fluctuate due to a variety of factors, including:
Revenue growth: Increased sales can boost net income, positively impacting EPS.
Cost control: Efficient cost management may improve profitability which maylead to a higher EPS.
Share buybacks: When a company repurchases its own shares, it reduces the number of outstanding shares, which may boost EPS even if net income remains constant.
Issuance of new shares: Conversely, if a company issues new shares, the number of outstanding shares increases, which may dilute EPS.
Limitations of EPS
While EPS is useful, it’s not perfect. Here are some limitations you should keep in mind:
1. Does not account for debt:
EPS does not directly account for a company’s debt levels. A company with high EPS might also have significant debt, which could pose a risk to its financial health.
2. Not always a true reflection of profitability:
EPS can be influenced by accounting adjustments, stock buybacks, or one-time gains or losses, which might not accurately reflect a company’s ongoing operational performance.
3. Ignores cash flow:
EPS is based on net income, which can differ from cash flow. A company might report high EPS but have weak cash flow, which could indicate issues with liquidity.
Understanding EPS as part of your investment strategy
It’s an important step to evaluate a company’s financials before investing, and calculating the EPS can offer helpful information. That said, it’s also important to use additional parameters such as P/E ratios and other valuation methods to ensure your overall assessment of the company matches expectations for performance and profitability.
Learning how stocks work doesn’t have to be complicated and stressful. Public has a variety of articles that can help you learn as you go. When you’re ready to get started, download the Public app.
Frequently asked questions
What is EPS in stocks, and what does the EPS calculation mean?
The EPS figure can help investors gain insight into a company’s profitability. Generally, the higher the number, the more profitable the company is, and the more investors want to own the stock, which may result in higher stock prices.
Does EPS mean the same thing as dividends?
No. EPS calculates the profitability of a company, and dividends are the money paid to shareholders.
What does a negative EPS finance mean?
A negative EPS can indicate that a company’s spending more than its earning or losing money, so other metrics should be considered when evaluating a company’s financial statements.
We use cookies and similar technologies as described in our
privacy policy.
You can manage your cookie settings at any time.