When analyzing stocks, identifying patterns can help you anticipate potential price movements and make informed decisions. One such pattern is the “cup and handle,” a chart formation often associated with bullish trends. In this blog, we’ll explore what the cup and handle pattern is, how to identify it, its implications for trading, and a real-world example to illustrate its practical application.
Cup and handle pattern: How to identify + Example
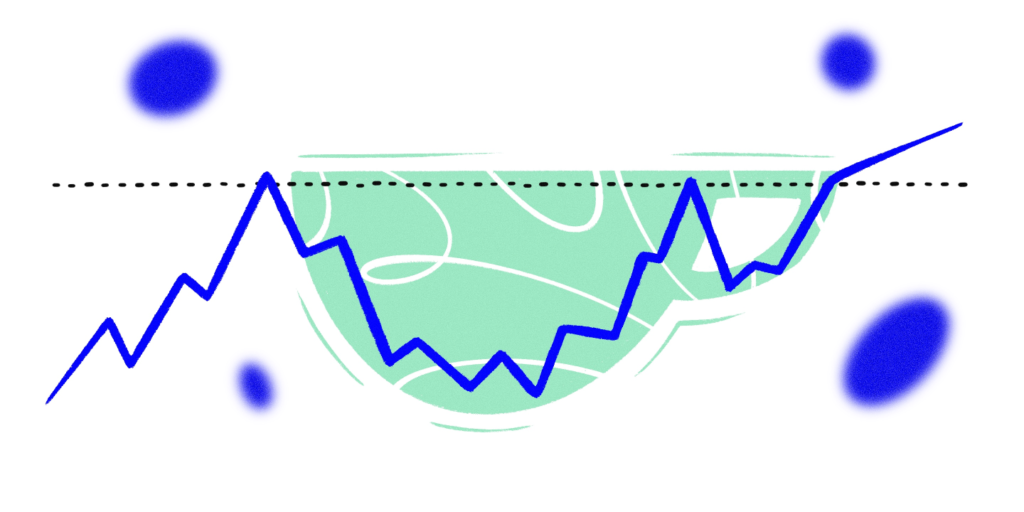
Table of contents
Key Takeaways
-
The cup and handle pattern is a bullish continuation pattern that helps traders identify potential breakout opportunities.
-
Its key components are the “cup,” which resembles a “U”-shaped recovery, and the “handle,” a small consolidation period before a breakout.
-
The pattern signals the potential for continued price increases, making it a valuable tool for timing trades.
-
Limitations exist, such as false breakouts and extended formation time, so combining it with other indicators is recommended for better accuracy.
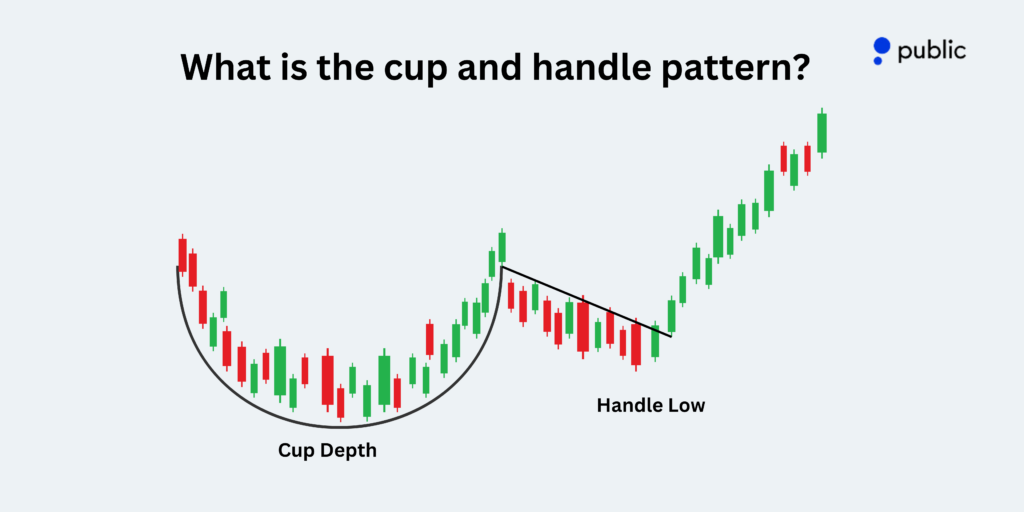
What is the cup and handle pattern?
The cup and handle pattern is a well-known chart pattern in technical analysis used by stock traders and investors to predict potential price increases. It’s a bullish continuation pattern, meaning it typically forms during an upward trend and signals that the stock price may rise further after the pattern completes.
Here’s how it gets its name:
- The cup: This is the first part of the pattern, which looks like a rounded “U” or bowl shape on the chart. It represents a period where the stock price declines, consolidates, and gradually recovers to its previous high.
- The handle: After forming the cup, the stock typically experiences a small pullback or consolidation, creating a smaller, downward-sloping trend line. This is called the handle.
When the stock price breaks out above the handle, it often signals the start of a new upward move, making this pattern valuable for identifying potential buying opportunities.
Characteristics of the cup and handle pattern
To effectively identify this pattern, look for the following characteristics:
1. Timeframe
The cup and handle pattern can develop over various timeframes, from daily to weekly or even monthly charts. Longer timeframes may provide more reliable insights.
2. Depth of the cup
The cup’s depth should not be excessively deep. Ideally, the retracement from the previous high should not exceed 50%. A shallow cup may often indicate stronger underlying demand.
3. Length of the handle
The handle should form over a shorter duration compared to the cup. It’s typically characterized by light trading volume, indicating minor profit-taking.
4. Volume during breakout
If the stock moves above the handle’s resistance level with higher trading volume, it may indicate stronger momentum.
5. Resistance level
The pattern’s breakout point is often at or slightly above the resistance level established by the cup’s rim.
What does a cup and handle pattern tell you?
The cup and handle pattern provides insights into a stock’s potential future performance. The cup shows a recovery phase where the price stabilizes and begins to rise after a decline, which may indicate growing confidence in the stock. The handle reflects a brief pause or small pullback as the market takes a breather before the next potential upward move.
When the stock price breaks above the resistance level at the top of the cup, this may signal strong buying interest and the possibility of continued upward momentum. This pattern may help you identify opportunities to buy a stock when it’s likely to gain strength, making it a valuable tool for timing your trades effectively.

How to interpret the cup and handle pattern
Step 1: Identify the pattern
Using a charting platform, look for the “U”-shaped cup followed by a smaller handle. Ensure the pattern meets the characteristics mentioned above.
Step 2: Observe the breakout
Monitor for the stock’s price movement above the handle’s resistance level. Increased trading volume at this stage can provide additional context.
Step 3: Consider risk management
Since price patterns can sometimes fail, it’s important to consider setting a stop-loss level to manage potential losses.
Step 4: Monitor for targets
While the cup and handle pattern may signal potential upward movement, the extent of the price change varies. Historical data and other indicators may provide additional insights.
Example of the cup and handle pattern
Imagine a stock’s price starts at $100, declines to $80, and then gradually rises back to $100, forming a “U” shape. This is the cup phase, indicating that the market has found a level of support at $80 and has recovered to its previous high. After reaching $100, the stock consolidates for a short period, with minor downward price movements creating the handle.
Eventually, the stock price breaks out above $100 with increased volume, signaling the completion of the pattern. The depth of the cup ($100 – $80 = $20) can be added to the breakout point ($100) to estimate a potential target price of $120.
This generic example illustrates how the cup and handle pattern might look in a typical scenario, offering insights into how the pattern’s breakout could align with anticipated price movements.

Limitations of cup and handle pattern
Despite its popularity, the cup and handle pattern has its limitations:
- Time to complete: The pattern’s formation can take weeks or months, which may not align with shorter-term strategies.
- Depth of the cup: While a shallow cup is a strong signal, a cup that is too deep may indicate excessive volatility or lead to ambiguous signals, making it harder to make confident decisions.
- Incomplete formation: Sometimes, a cup forms without a clear handle, raising questions about whether the pattern is valid or signaling a false breakout.
- Reliability issues: Although the cup and handle is a valuable tool, it isn’t foolproof and may not always provide accurate signals. Using additional indicators may help validate insights.
Bottom line
The cup and handle pattern is a widely recognized tool for analyzing potential price movements in the stock market. By understanding its characteristics, implications, and limitations, you can incorporate it into your broader investment research.
Frequently asked questions
Can the cup and handle pattern occur in other asset classes?
Yes, the pattern can appear in commodities, forex, and cryptocurrencies, provided the underlying asset exhibits similar price behavior.
What happens if the cup and handle pattern breaks downward?
A downward movement from the handle’s support level might invalidate the pattern. It’s essential to reassess your analysis in such cases.
Is the cup and handle pattern suitable for day trading?
While more common on longer timeframes, the pattern can occur intraday. However, shorter durations might lead to less reliable signals.