Are you interested in investing in growth stocks but unsure how to value them? The Price/Earnings-to-Growth (PEG) ratio can help by including expected earnings growth in its valuation.
This article will explain how to use the PEG ratio to make smart investment decisions.
What Is the PEG Ratio?
Defining the PEG Ratio
The Price/Earnings-to-Growth (PEG) ratio improves on the Price/Earnings (P/E) ratio by including a company’s earnings growth. This makes it a more useful tool for evaluating a stock’s value, helping to decide if a stock is under or overvalued based on its expected earnings growth.
How the PEG Ratio Enhances the P/E Ratio
The P/E ratio shows a stock’s current value compared to its earnings, but it doesn’t account for the company’s growth potential. The PEG ratio fixes this by dividing the P/E ratio by the annual earnings per share (EPS) growth rate, adding growth into the valuation.
How to Calculate the PEG Ratio
Step-by-Step Calculation
To calculate the PEG ratio, you need two pieces of information:
- Price/Earnings (P/E) Ratio: This is calculated by dividing the current market price of the stock by its earnings per share (EPS).
- Earnings Growth Rate: This is the projected annual growth rate of the company’s earnings.
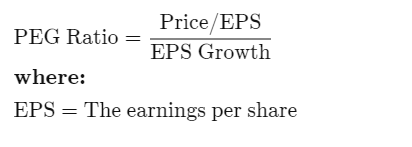
The formula for the PEG ratio is:
PEG Ratio = ( Price / EPS ) / Earnings Growth
Understanding the PEG Ratio for Evaluating Stock Value
Evaluating Stock Value with the PEG Ratio
The PEG ratio is a useful metric for assessing how a stock is priced in relation to its earnings growth expectations.
A PEG ratio less than 1.0 might indicate that a stock’s price is low compared to its anticipated growth in earnings, suggesting it could be less expensive relative to its future earnings potential.
Conversely, a PEG ratio greater than 1.0 might suggest that a stock is priced high relative to its expected earnings growth, indicating it could be more expensive.
Using the PEG Ratio Across Different Industries
The inclusion of growth rate considerations makes the PEG ratio valuable for comparing companies across different industries, which may experience different growth rates.
This aspect of the PEG ratio helps provide a more nuanced view, enabling more grounded comparisons of company values in varying sectors.
Example of How to Use the PEG Ratio
Analyzing Stock Value Using the PEG Ratio
To demonstrate the utility of the PEG ratio in stock evaluation, let’s consider an example involving two fictional companies: TechGrow Inc. and StableCorp. Both companies are listed on the stock market, but they operate in different industry sectors and exhibit distinct growth patterns.
TechGrow Inc:
- Price per share = $100
- EPS this year = $5.00
- EPS last year = $4.00
Calculated P/E ratio: $100 / $5.00 = 20
Earnings growth rate: ($5.00 / $4.00) – 1) = 25%.
PEG ratio: 20 / 25 = 0.8
StableCorp:
- Price per share = $50
- EPS this year = $2.50
- EPS last year = $2.40
Calculated P/E ratio: $50 / $2.50 = 20.
Earnings growth rate: $2.50 / $2.40) – 1 = 4.17%.
PEG ratio: 20 / 4.17 = 4.8.
Analysis and Implications
In this example, despite both companies having the same P/E ratio of 20, their PEG ratios differ significantly due to their growth rates.
TechGrow Inc. has a PEG ratio of 0.8, which suggests its stock might be undervalued based on its growth potential, making it a more appealing investment.
In contrast, StableCorp has a PEG ratio of 4.8, indicating its stock is overvalued given its slower earnings growth, making it less attractive.
This example shows how the PEG ratio can be an important tool in comparing stocks across different industries and with varying growth rates, providing a clearer picture of potential investment value relative to future earnings growth.
Conclusion
While the P/E ratio is a common tool for assessing stock value, the PEG ratio offers a more comprehensive evaluation by including future earnings growth. This added dimension helps paint a more detailed picture of a company’s market value relative to its projected earnings.
However, the accuracy of the PEG ratio heavily depends on the quality of the earnings growth forecasts used. Inaccurate predictions or the inappropriate extension of past growth trends into the future can lead to misleading PEG ratios, making it crucial to use reliable and thoughtful estimates.


